Class
WebGraphics
Graphics
Description
WebGraphics class objects are used for drawing text, lines, rectangles, ovals, and pictures from within the a WebCanvas event.
Properties
Name |
Type |
Read-Only |
Shared |
|---|---|---|---|
✓ |
|||
✓ |
Methods
Name |
Parameters |
Returns |
Shared |
|---|---|---|---|
x As Integer, y As Integer, width As Integer, height As Integer |
|||
r As Rect |
|||
x As Integer, y As Integer, width As Integer, height As Integer |
|||
r As Rect |
|||
path As GraphicsPath, autoClose As Boolean = False |
|||
pic As Picture, x As Integer, y As Integer, width As Integer = 0, height As Integer = 0 |
|||
points() As Integer |
|||
x As Integer, y As Integer, width As Integer, height As Integer |
|||
r As Rect |
|||
x As Integer, y As Integer, width As Integer, height As Integer, cornerWidth As Integer |
|||
text As String, x As Integer, y As Integer, width As Integer = 0 |
|||
x As Integer, y As Integer, width As Integer, height As Integer |
|||
r As Rect |
|||
path As GraphicsPath, autoClose As Boolean = False |
|||
points() As Integer |
|||
X As Integer, Y As Integer, Width As Integer, Height As Integer |
|||
r As Rect |
|||
x As Integer, y As Integer, width As Integer, height As Integer, cornerWidth As Integer |
|||
size As Integer, col As Color, offsetX As Integer = 4, offsetY As Integer = 4 |
Enumerations
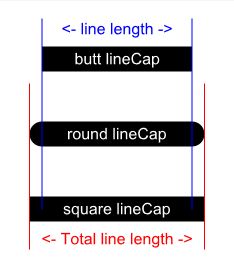
WebGraphics.LineCapTypes
LineCapTypes
Specifies the types of caps (endings) that will be drawn on the end of lines drawn with the DrawLine method.
Enum
Description
Butt
A squared-off ending that ends at the line boundary.
Round
A rounded ending that extends beyond the line boundary.
Square
A squared-off ending that extends beyond the line boundary.
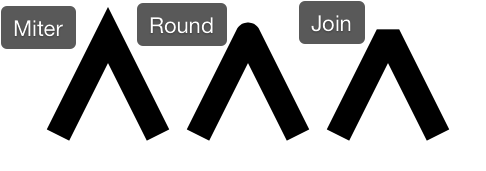
WebGraphics.LineJoinTypes
LineJoinTypes
Specifies the type of path to be used to open the folderitem.
Enum
Description
Butt
A squared-off ending that ends at the line boundary.
Round
A rounded ending that extends beyond the line boundary.
Square
A squared-off ending that extends beyond the line boundary.
Property descriptions
WebGraphics.Bold
Bold As Boolean
If True, text will appear in bold when using WebGraphics.
In the WebCanvas event handler, this code displays bold text:
g.Bold = True
g.DrawText("Hello World!", 10, 100)
WebGraphics.DrawingColor
DrawingColor As Color
The currently selected color for the WebGraphics object. This color is used by the various drawing methods.
This example draws a red rectangle:
g.DrawingColor = Color.Red
g.FillRectangle(10, 10, 100, 100)
WebGraphics.FontName
FontName As String
Name of the font used to draw text with the DrawText method.
You can use any font supported by the web browser. For best results you will want to stick with the standard Web Safe Fonts.
g.FontName = "Arial"
g.DrawText("Hello World!", 10, 10)
WebGraphics.FontSize
FontSize As Integer
Sets the size of the text to display using the DrawText method.
This code draws large text:
g.FontSize = 48
g.DrawText("Hello World!", 10, 100)
WebGraphics.Height
Height As Integer
WebGraphics.Italic
Italic As Boolean
If True, text will appear in italic when using WebGraphics.
This example draws "Hello World" in red italic inside a WebCanvas.
g.DrawingColor = &cff0000
g.Italic = True
g.DrawText("Hello world", 10, 10)
WebGraphics.LineCap
LineCap As LineCapTypes
Specified Butt, Round or Square as the Line Cap.
Use WebGraphics.LineCapType enumeration to set the LineCap. Values are Butt, Round and Square.
 g.LineCap = WebGraphics.LineCapType.Round
WebGraphics.LineJoin
LineJoin As LineJoinTypes
Specified Bevel, Miter, Round as the Line Join.
Use WebGraphics.LineJoinType enumeration to set the LineJoin. Values are Bevel, Miter and Round.
 g.LineJoin = WebGraphics.LineJoinType.Miter
WebGraphics.PenSize
PenSize As Integer
The drawing pen is always square, so this specifies both the width/height (in pixels) used when drawing lines, ovals and rectangles.
This example sets the PenSize to 5 pixels to draw a rectangle with a thick border:
g.PenSize = 5
g.DrawRectangle(150, 10, 100, 100)
WebGraphics.TextAlignment
TextAlignment As TextAlignments
Sets the text alignment of text created with DrawText.
This code centers the text in the drawing area:
Var txt As String = "Hello World"
Var y As Integer = 100
Var alignX As Integer = g.Width / 2
g.TextAlignment = TextAlignments.Center
g.DrawText(txt, alignX, y)
Show left-aligned, right-aligned and centered text, both within a Rect and within the entire Canvas. Be sue the Canvas is locked to all page edges so that it is large enough:
g.DrawRectangle(0, 10, 200, 100)

g.TextAlignment = TextAlignments.Left
g.DrawText("Left-aligned (Box)", 5, 20) ' in box
g.DrawText("Left-aligned (Canvas)", 5, 200, g.Width) ' in canvas

g.TextAlignment = TextAlignments.Right
g.DrawText("Right-aligned (Box)", 195, 40) ' in box
g.DrawText("Right-aligned (Canvas)", g.Width, 250, g.Width) ' in canvas

g.TextAlignment = TextAlignments.Center
g.DrawText("Centered (Box)", 100, 60) ' in box
g.DrawText("Centered (Canvas)", g.Width / 2, 300, g.Width) ' in canvas
This code splits a number into two parts so you can do decimal alignment:
Var c As Currency = 15.32
Var cText As String = c.ToString
Var parts() As String = cText.ToArray(".")
Var y As Integer = 100
Var alignX As Integer = g.Width/2
g.TextAlignment = WebGraphics.TextAlignmentRight
g.DrawText(parts(0) + ".", alignX, y)
g.TextAlignment = WebGraphics.TextAlignmentLeft
g.DrawText(parts(1), alignX, y)
WebGraphics.Width
Width As Integer
Method descriptions
WebGraphics.ClearRectangle
ClearRectangle(x As Integer, y As Integer, width As Integer, height As Integer)
Clears the rectangle described by the parameters passed by filling it with the background color.
This example clears the entire drawing area:
g.ClearRectangle(0, 0, g.Width, g.Height)
ClearRectangle(r As Rect)
Clears the rectangle described by the Rect parameter r passed by filling it with the background color.
This example clears the entire drawing area:
Var r As New Rect(0, 0, g.Width, g.Height)

g.ClearRectangle(r)
WebGraphics.DrawLine
DrawLine(x1 As Integer, y1 As Integer, x2 As Integer, y2 As Integer)
Draws a line from x1, y1 to x2, y2 in the current color (specified by DrawingColor).
Draws a line from the top left to the bottom right:
g.PenSize = 5
g.DrawLine(0, 0, g.Width, g.Height)
WebGraphics.DrawOval
DrawOval(x As Integer, y As Integer, width As Integer, height As Integer)
Draws the outline of an oval in the current color (specified by DrawingColor property). x and y are the coordinates of the top-left corner. width and height specify the size of the oval.
The following example sets the width and draws the oval. The code is in the Paint event of a WebCanvas.
g.PenSize = 5
g.DrawOval(10, 10, 100, 60)
DrawOval(r As Rect)
Draws the outline of an oval in the current color (specified by DrawingColor property) at the Rect r passed.
The following example sets the size and draws the oval. The code is in the Paint event of a WebCanvas.
Var r As New Rect(10, 10, 100, 60)

g.PenSize = 5
g.DrawOval(r)
WebGraphics.DrawPath
DrawPath(path As GraphicsPath, autoClose As Boolean = False)
Draws a bezier line along the path designated.
When autoClose is True, the path will be automatically closed so that there are no gaps in it.
WebGraphics.DrawPicture
DrawPicture(pic As Picture, x As Integer, y As Integer, width As Integer = 0, height As Integer = 0)
Draws the picture from a WebImageViewer at the specified location. The picture can be shown at full size or cropped. All units are pixels.
x and y are the distances from the top-left corner of the control or window from which the 0, 0 point of the image will be drawn. The optional parameters are used to copy a portion of the picture for cropping.
If you are cropping, then width and height are required.
The following code crops the image. It copies only the top 150 pixels of the original image at full size:
g.DrawPicture(myImage, 0, 0, 600, 150)This draws the full image:
g.DrawPicture(myImage, 0, 0)
WebGraphics.DrawPolygon
DrawPolygon(points() As Integer)
Draws a polygon using the values in the 1-based array passed as the X and Y coordinates. The polygon is drawn in the current color (specified by DrawingColor). Odd numbered array elements are X coordinates and even numbered array elements are Y coordinates.
Polygons are drawn using the DrawPolygon and FillPolygon methods of the WebGraphics class. Polygons are drawn by passing the DrawPolygon or FillPolygon method an Integer array that contains each point in the polygon. This is a 1-based array where odd numbered array elements contain X values and even numbered array elements contain Y coordinates. This means that element 1 contains the X coordinate of the first point in the polygon and element 2 contains the Y coordinate of the first point in the polygon. Consider the following array values:
Element #
Value
1
10
2
5
3
40
4
40
5
5
6
60
When passed to the DrawPolygon or FillPolygon method, this array would draw a polygon by drawing a line starting at 10,5 and ending at 40,40 then drawing another line starting from 40,40 ending at 5,60 and finally a line from 5,60 back to 10,5 to complete the polygon. This polygon has only three sets of coordinates so it is a triangle.
This code is in the Paint event of a WebCanvas control:
Var points(6) As Integer

points(1) = 10
points(2) = 5
points(3) = 40
points(4) = 40
points(5) = 5
points(6) = 60

g.DrawPolygon(points)
FillPolygon draws the same polygon but with the interior filled with the DrawingColor:

Another way of populating the array is with the Array function. The Array function takes a list of values separated by commas and populates the array, beginning with element zero. Since the first element that DrawPolygon uses is element 1, you can use any value in element zero. This code is in the Paint event.
Var points() As Integer
points = Array(0, 10, 5, 40, 40, 5, 60)
g.DrawPolygon(points)
WebGraphics.DrawRectangle
DrawRectangle(x As Integer, y As Integer, width As Integer, height As Integer)
Draws the outline of a rectangle in the DrawingColor. x and y are the coordinates of the top-left corner. width and height specify the size of the rectangle.
This example draws two squares with a 5-pixel red border:
g.DrawingColor = Color.Red
g.PenSize = 5
g.DrawRectangle(10, 10, 100, 100)
g.DrawRectangle(130, 10, 100, 100)
DrawRectangle(r As Rect)
Draws the outline of a rectangle in the DrawingColor at the Rect r passed.
This example draws two squares with a 5-pixel red border:
Var r1 As New Rect(10, 10, 100, 100)
Var r2 As New Rect(130, 10, 100, 100)

g.DrawingColor = Color.Red
g.PenSize = 5
g.DrawRectangle(r1)
g.DrawRectangle(r2)
WebGraphics.DrawRoundRectangle
DrawRoundRectangle(x As Integer, y As Integer, width As Integer, height As Integer, cornerWidth As Integer)
x and y are the coordinates of the top-left corner. width and height specify the size of the round rectangle. cornerWidth controls the shape of the corners of both the horizontal and vertical axes. It is the distance (in pixels) from the corner at which the arc begins. Setting cornerWidth to zero results in a rectangle with sharp corners (a normal rectangle).
This example draws two squares with a 5-pixel red border. The left square sets the arcs to 10 and the right one to 25.
g.DrawingColor = Color.Red
g.PenSize = 5
g.DrawRoundRectangle(10, 10, 100, 100, 10)
g.DrawRoundRectangle(130, 10, 100, 100, 25)
DrawRoundRectangle(r As Rect, cornerWidth As Integer)
Draws a filled round rectangle at the Rect r passed. cornerWidth controls the shape of the corners of both the horizontal and vertical axes. It is the distance (in pixels) from the corner at which the arc begins. Setting cornerWidth to zero results in a rectangle with sharp corners (a normal rectangle).
This example draws a red rounded square with a 5-pixel red border and sets the arcs to 25.
Var r As New Rect(130, 10, 100, 100)

g.DrawingColor = Color.Red
g.PenSize = 5
g.DrawRoundRectangle(r, 25)
WebGraphics.DrawText
DrawText(text As String, x As Integer, y As Integer, width As Integer = 0)
Draws the text at the specified location and in the DrawingColor.
The x parameter specifies the distance from the left of the WebGraphics object in pixels. The y parameter specifies the baseline for the text. The optional width parameter specifies the width (in pixels) at which text should wrap. If width is omitted, then text will print on one line, even if the drawing area is too narrow to contain the text.
This example draws text in red Helvetica 16-point.
g.DrawingColor = Color.Red
g.FontName = "Helvetica"
g.FontSize = 16
g.DrawText("Hello world!", 10, 130)
WebGraphics.FillOval
FillOval(x As Integer, y As Integer, width As Integer, height As Integer)
Draws an oval filled with the current color (specified by DrawingColor). x and y are the coordinates of the top-left corner. width and height specify the size of the oval.
The following example draws a filled oval. The code is in the Paint event of a WebCanvas:
g.DrawingColor = &cff0000
g.FillOval(10, 10, 100, 60)
FillOval(r As Rect)
Draws an oval filled with the current color (specified by DrawingColor) at the Rect r passed.
The following example draws a filled oval.The code is in the Paint event of a WebCanvas.
Var bounds As New Rect(10, 10, 100, 60)

g.PenSize = 5
g.FillOval(bounds)
WebGraphics.FillPath
FillPath(path As GraphicsPath, autoClose As Boolean = False)
Draws a bezier line along the path designated and fills the region with the current DrawingColor value.
When autoClose is True, the path will be automatically closed so that there are no gaps in it.
WebGraphics.FillPolygon
FillPolygon(points() As Integer)
Draws a polygon using the values in the 1-based array passed as the X and Y coordinates. The polygon is filled using the DrawingColor. Odd numbered array elements are X coordinates and even numbered array elements are Y coordinates.
Polygons are drawn using the DrawPolygon and FillPolygon methods of the WebGraphics class. Polygons are drawn by passing the DrawPolygon or FillPolygon method an Integer array that contains each point in the polygon. This is a 1-based array where odd numbered array elements contain X values and even numbered array elements contain Y coordinates. This means that element 1 contains the X coordinate of the first point in the polygon and element 2 contains the Y coordinate of the first point in the polygon. Consider the following array values:
Element #
Value
1
10
2
5
3
40
4
40
5
5
6
60
When passed to the DrawPolygon or FillPolygon method, this array would draw a polygon by drawing a line starting at 10,5 and ending at 40,40 then drawing another line starting from 40,40 ending at 5,60 and finally a line from 5,60 back to 10,5 to complete the polygon. This polygon has only three sets of coordinates so it is a triangle.
This code is in the Paint event of a WebCanvas control:
Var points(6) As Integer

points(1) = 10
points(2) = 5
points(3) = 40
points(4) = 40
points(5) = 5
points(6) = 60

g.FillPolygon(points)
FillPolygon draws the same polygon but with the interior filled with the DrawingColor:
Another way of populating the array is with the Array function. The Array function takes a list of values separated by commas and populates the array, beginning with element zero. Since the first element that DrawPolygon uses is element 1, you can use any value in element zero. This code is in the Paint event.
Var points() As Integer = Array(0, 10, 5, 40, 40, 5, 60)

g.FillPolygon(points)
WebGraphics.FillRectangle
FillRectangle(X As Integer, Y As Integer, Width As Integer, Height As Integer)
x and y are the coordinates of the top-left corner. width and height specify the size of the rectangle.
This example draws two red squares:
g.DrawingColor = Color.Red
g.FillRectangle(10, 10, 100, 100)
g.FillRectangle(130, 10, 100, 100)
FillRectangle(r As Rect)
Draws a filled rectangle at the Rect r passed.
This example draws two red squares:
Var r1 As New Rect(10, 10, 100, 100)
Var r2 As New Rect(130, 10, 100, 100)

g.DrawingColor = Color.Red
g.FillRectangle(r1)
g.FillRectangle(r2)
WebGraphics.FillRoundRectangle
FillRoundRectangle(x As Integer, y As Integer, width As Integer, height As Integer, cornerWidth As Integer)
x and y are the coordinates of the top-left corner. width and height specify the size of the round rectangle. cornerWidth controls the shape of the corners of both the horizontal and vertical axes. It is the distance (in pixels) from the corner at which the arc begins. Setting cornerWidth to zero results in a rectangle with sharp corners (a normal rectangle).
This example draws two red rounded squares. The left square sets the arcs to 10 and the right one to 25.
g.DrawingColor = Color.Red
g.FillRoundRectangle(10, 10, 100, 100, 10)
g.FillRoundRectangle(130, 10, 100, 100, 25)
FillRoundRectangle(r As Rect, cornerWidth As Integer)
Draws a filled round rectangle at the Rect r passed. cornerWidth controls the shape of the corners of both the horizontal and vertical axes. It is the distance (in pixels) from the corner at which the arc begins. Setting cornerWidth to zero results in a rectangle with sharp corners (a normal rectangle).
This example draws a red rounded square and sets the arcs to 25.
Var r As New Rect(130, 10, 100, 100)

g.DrawingColor = Color.Red
g.FillRoundRectangle(r, 25)
WebGraphics.Restore
Restore
Pops the top state on the stack, restoring the graphics context to that state.
WebGraphics.Save
Save
Saves the current state of the graphics context onto the stack.
WebGraphics.Shadow
Shadow(size As Integer, col As Color, offsetX As Integer = 4, offsetY As Integer = 4)
Renders shadows for all drawing commands that follow:
size: How much to blur the shadow
col: Color of the shadow
offsetX: How far to move the shadow to the right
offsetY: How far to move the shadow downward
Draws a blue rectangle with a red shadow:
g.Shadow(12, &cff0000, 3, 3)
g.DrawingColor = &c0000ff
g.FillRectangle(10, 10, 100, 100)
Notes
The x and y parameters of the methods are the horizontal and vertical coordinates of the left-top corner of the object being drawn or cleared. The origin (0, 0) is the top-left corner of the control or window in which the drawing is being done.
For example, 50, 50 is 50 pixels to the right and 50 pixels down from the top-left of the window or control.
Compatibility
Project Types |
Web |
Operating Systems |
All |