Report Layout Editor
The Report Layout Editor is used to design reports for desktop apps. The Report Layout Editor can only be used with Desktop projects.
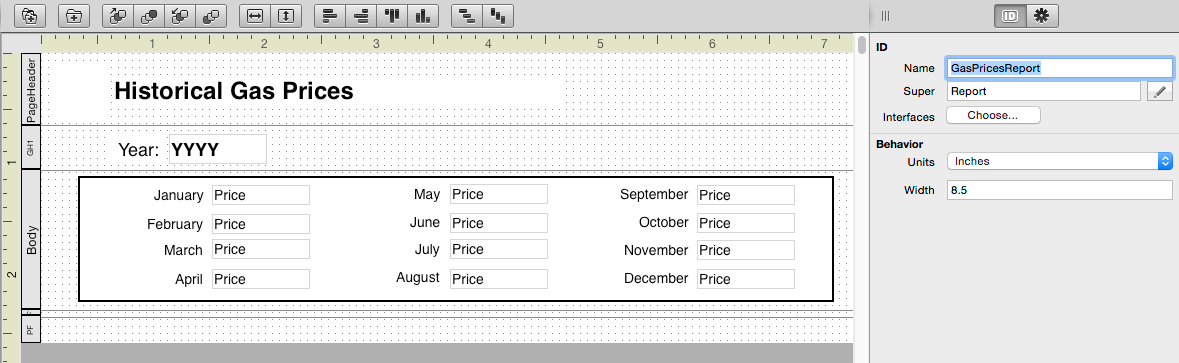
To create a report, use the Insert button or menu and select Report. This adds a report to your project and displays the Report Layout Editor.
You can specify the units for the ruler in Inches, Millimeters or Pixels and specify the width of the report page using the Inspector.
Much like the Window Layout Editor, you drag controls onto the Report Layout Editor to design you reports. The Reports uses a “banded” report design containing multiple bands where information can appear. By default, you see three bands: PageHeader, Body and PageFooter.
Whatever is in the PageHeader band appears at the top of every page, including the first page. Similarly, what is in the PageFooter band appears at the bottom of every page, including the first page.
The Body band is repeated for each line of data that is in the report. For example, if you have a report that is displaying a list of Teams, then you will get a separate Body band for each team.
In order to display data, a report has to have a data set, which is discussed in the Displaying Desktop Reports topic.
Command bar
The command bar has these commands:
Item |
Description |
|---|---|
Add Group |
Adds a new Group to the report layout. This adds both a Group Header and a Group Footer to the layout. |
Add Page Header/Footer |
Used to add a Page Header/Footer to a report. A report can only have a single set of Page Header/Footer bands. Since it is possible to delete these bands, use this item to add them back. |
Ordering |
Changes the layering of the controls on the report layout. |
Fill |
Fills the size of the control to match its parent container. |
Alignment |
Aligns selected report controls with each other. |
Spacing |
Spaces the selected report controls equally apart from each other. |
Library and Inspector
The Library displays the report controls that can be added to the report layout. The Inspector displays the properties for the selected report control.
Report Layout Editor controls
There are a variety of controls that you can use in your reports, including: Field, Label, Picture, Line, Oval, Rectangle, RoundRectangle, Date and Page Number. Each control has two events that can be used for any processing: AfterPrinting and BeforePrinting.
Field - A Field on a report is used to display report data. The fields map to the data source you use with the report, by specifying a value in the DataField property. Generally, you use Fields within the Body band, but they work in any band.
Label - Like a Label on a Window or Web Page, a Label on a report displays text. Labels are used for things like report titles and column headings.
Picture - A Picture is used to display a picture on the report. The picture can be specified when you are designing the report or it can be specified at runtime using information in your data source.
Line, Oval, Rectangle, RoundRectangle - Used to draw shapes on the report.
Date - Used to display the current date when the report is generated.
Page Number - Displays the page number on each page of the report.
Grouping
Groups are used to display related data together. For example, in the Team and Player examples, there are two sources of data: teams and players. You could use Grouping on a report to display the teams with each player on the team listed below the team name and perhaps indented slightly.
To add a group to the report, you click the “Add New Group” button on the toolbar. This creates two new bands, called GroupHeader1 and GroupFooter1, where you can place additional information. The information in the Group Header appears once for each group. The information in the Group Footer also appears once for each group, but is displayed after the information in the Detail band.