Debugger usage
When you run your project from within Xojo, you are using the debugger. If there are no errors after compiling and building your app, it launches and the Workspace switches to the debugger tab. This is referred to as running the project in “debug mode”.
The standard way to run your project in debug mode is to choose Project > Run from the menu or click the Run button on the toolbar.
Note
If you ever have difficulty debugging your web app (such as it not starting), make sure the debug port is not in use by another app on the computer. When in doubt, change the Debug Port to another value. In addition, the App Name and Application Identifier need to be different.
The Run Paused item in the menu, builds a debug version of your app but does not actually run it. You'll need to manually go to your OS file viewer and launch the app. This can be used by advanced users for times when you have to do some manually setup before the app should start, such as manually start some other service, install files, etc.
The Run Remotely item in the menu can be used to remote debug your app on a different computer. Refer to Remote Debugging for more information.
While you are using your app you will not normally see the debugger, but there are several ways it can be activated.
Activating the Debugger
There are several ways the debugger can become active: you can manually activate it, your app can raise an exception, you can set a breakpoint or call the Break method. When the debugger is activated, the Xojo IDE becomes frontmost and the debugger tab is displayed, usually showing source code.
From the debugger tab you are able to view variable values and review the call stack.
Manual activation
You can manually activate the debugger by clicking the Pause button on the Debugger toolbar while your app is running. If your code is currently running, then this displays the method that is running and highlights the next line of code that will execute.
If your app was idle, then this drops you into the Event Loop where you can view global objects and their variables (such as App, Runtime and modules).
Note
Viewing global variables and objects (such as modules) in the Debugger is not currently supported for Android.
App errors
There are two ways in which your app could cause an error that would then stop code execution and display the Debugger.
The most common is an Exception. An Exception means that something unusual has occurred. Should your app raise an exception while you are running in debug mode (and Project > Break On Exceptions is checked), the debugger becomes active (this is called a Runtime Error). The source code where the exception was raised is displayed.
This only occurs if you have Project > Break On Exceptions checked. When checked, the debugger is activated for all exceptions that are raised, even ones that are caught later by a Catch statement. Click Resume to allow your app to continue and run the Catch code. To temporarily alter the Break On Exceptions behavior, you can use the #Pragma BreakOnExceptions Off for a code block like this:
#Pragma BreakOnExceptions Off
Try
  ' your code
Catch e As NilObjectException
  ' handle exception
End Try
#Pragma BreakOnExceptions Default ' Restore setting from Project menu
The second, less common way, is when the application crashes typically as a result of some conflict with the operating system. Should your app raise an exception while you are running in debug mode (and Project > Break On Fatal Error is checked), the debugger becomes active. The source code where the crash occurred is displayed with a bomb icon on the line where the crash occurred. Should this happen and the cause is a call to part of the Xojo framework, please file a bug report with us.
Breakpoint
In your code you can set breakpoints. A breakpoint is an indicator that tells the debugger to activate itself when the line of code is reached.
For example, you might want to set a breakpoint at the start of a method if you want to carefully review the code as it executes.
To set breakpoints, you click on the “dashes” that appear in the gutter of the Code Editor. Each dash indicates a line of code that can have a breakpoint set. You can also set a breakpoint using the Project > Breakpoint > Turn On menu (⌘ \ on macOS, Ctrl \ on Windows and Linux). The same command turns off a previously set breakpoint on the line.
If you want to turn off all breakpoints throughout your project, use the Project > Breakpoint > Clear All menu. To see all breakpoints in your project, use Project > Breakpoint > Show All menu to display the breakpoints in the Find panel. If you want to keep all your breakpoints but have Xojo ignore them temporarily, choose the Project > Breakpoint > Ignore All menu.
Conditional breakpoint
There will be times where you may want to stop at a breakpoint, but only if a specific condition occurs. For example, you could be in a long loop and you only want to stop at the 75th element.
This can be done two different ways. You can use the Debugger itself or you can do it via code.
To cause the Debugger to stop when a condition is met, create a Watchpoint. Information on Watchpoints can be found here.
Alternatively, you set up a condition breakpoint in your source code using a combination of a conditional If statement and the Break command. This example will stop at the breakpoint when the loop counter reaches 75:
For i As Integer = 1 To 100
  If i = 75 Then Break
Next
The Break command is called when i reaches 75, activating the debugger.
The Break command does not do anything in a built application so you do not have to remove them before you Build your app. It is only used when running your app in Debug Mode.
Another way to be notified of the change of a value is to create a computed property and then set a breakpoint within its Setter. This will cause the debugger to appear any time the property is assigned a value.
The Debugger screen
Once you are in the debugger, you can control it using these command bar commands: Pause/Resume, Stop, Step, Step In, Step Out, Edit Code and Toggle Line Numbers.
Pause/Resume: Use Pause to pause a running app and activate the debugger. If you are in the debugger, the Resume button tells your app to continue running where it left off. You can also click the Run button on the main toolbar to Resume, select Project > Resume from the menu or you can use the ⌘ R (Ctrl R on Windows and Linux) shortcut.
Stop: The Stop button immediately stops the running app. The app is quit immediately and no further code is run. You can also use the shortcut Shift ⌘ R (Shift Ctrl R on Windows and Linux).
Step: The Step button is used to run the code one line at a time. Each time you click Step, the highlighted code is executed and you remain in the debugger. If you click Step while on a method call, the method is called and you move to the next line of code after the method call. Step is the command you use most often while debugging. In addition to clicking the button, you can use Project > Step > Step Over menu command or the shortcut Shift ⌘ O (Shift Ctrl O on Windows and Linux).
Step In: The Step In button works like the Step button except when you reach a method call. Instead of calling the method and moving to the next line of code, Step In moves you to the first line of code in the method. In addition to clicking the button, you can use Project > Step > Step Into menu command or the shortcut Shift ⌘ I (Shift Ctrl I on Windows and Linux).
Step Out: If you are in a method, clicking Step Out, runs the rest of the code in the method and then stops when the method returns. In addition to clicking the button, you can use Project > Step > Step Into menu command or the shortcut Shift ⌘ T (Shift Ctrl T on Windows and Linux).
Edit Code: The Edit Code button allows you to jump to the Code Editor for the current method that is in the debugger. Here you can edit the code (which you can not do in the code display of the debugger). However, changes that you make to code in the Code Editor are not reflected in the currently running app. You'll need to quit and re-run the app to see the changes you made.
Toggle Line Numbers: Toggles the display of line numbers on or off.
Note
When using the Step button, if you step through a line of code that causes an event to execute (for example, changing the Text property of a TextField in code will cause its TextChanged event to execute), the Debugger will not step into the code for that event. If you want to step into that event, use the Step In button instead.
Watching variables
The watch pane of the debugger allows you to view the values of variables. By default it shows you the currently declared variables for the method that is executing. You can change the values of variables that are Boolean, Integer, Double and String by clicking on the value (or selecting the pencil icon on the far right), entering a new value and pressing Return.
Note
For Boolean variables, anything entered besides True or true is treated as False.
With String variables, the pencil icon on the right changes to show a magnifying glass. Clicking this displays a text editor which lets you view the text or its binary/hex representation. It also allows you to make changes to the string using a larger editing area.
For Text variables, you can display the text itself as well as its Unicode representation.
For integers, you can change the display format by right-clicking on the value and selecting View As Decimal, Hex, Binary or Octal.
For doubles, you can change the display format by right-clicking on the value and selecting View As Scientific, Decimal or Rounded.
If the variable type is a class, then you can click on the type (the class name) to display its property values. You can then click on the properties to see their values.
Constants do not appear in the debugger.
At the top of the variables pane is a Popup Menu that allows you to navigate the variable hierarchy. You can use it to quickly jump back to the method variables after having displayed the string editor or class instance details.
On some objects (such as Windows and RowSets), there is a special link at the top called “Contents”. Clicking this displays information about the object, such as the controls on a window or the fields in a RowSet. You can click on these items to view their properties.
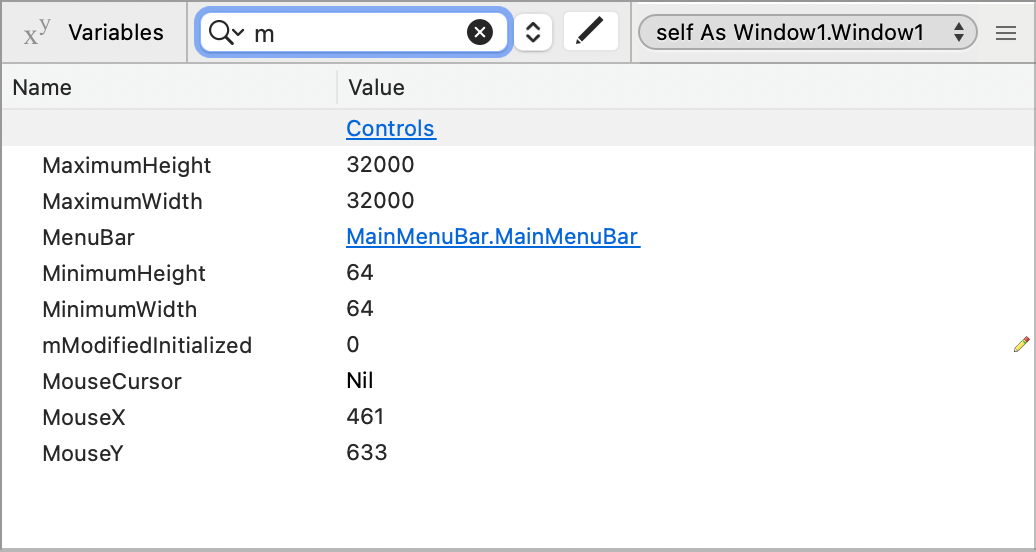
Displaying only specific variables/properties
The Filter field allows you to reduce the list of items in the Variables pane to just those whose names begin with, contains or ends with the text you enter. For example, entering just the letter m will display only those items that begin with that letter:
You can choose Begins With, Contains or Ends With from the popup menu to the right of the Filter field. The default is Begins With.
You can apply multiple filters as well by providing a comma-separated value. For example, c, m would display all items that begin with the letters c or m.
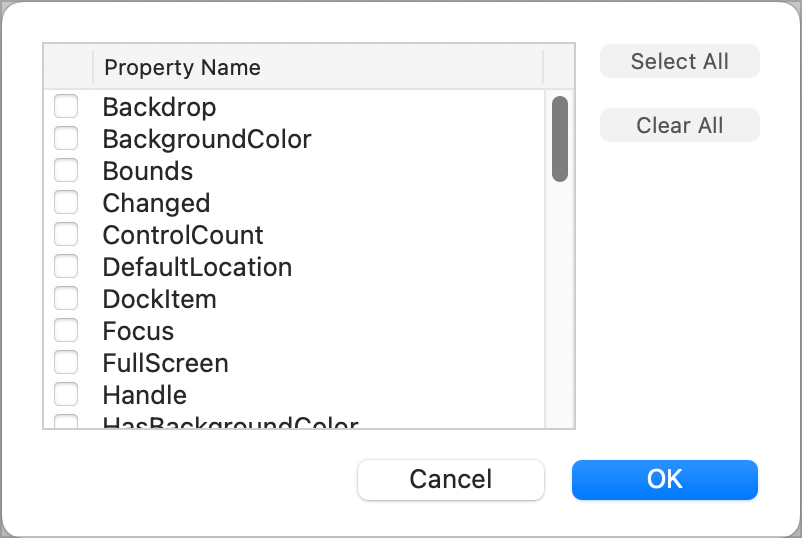
Alternatively, clicking the Pencil icon to the right of the Filter field allows you to select items by name rather than typing.
Note
The filters you enter are remembered from one debug session to the next.
Viewing source code
The source code for the current method (or event or computed property) displays in the debugger code viewer. The next line to execute is highlighted. In the code viewer, you can set additional breakpoints and watch the highlight move as you step through code.
If you want to edit the code, click the Edit Code button on the command bar. Changes made to code do not take effect until the next time you run your project.
Viewing the call stack
The call stack displays the calling hierarchy of your methods. If your main window Opening event calls a method named Initialize then the call stack shows Initialize at the top (since it is the current method) with Window1.Opening underneath it. The call stack is very helpful for viewing your code path and for figuring out the methods that call other methods. You can click on prior items in the call stack to view its source code.
Viewing threads
Each thread in your app is tracked separately in the debugger.
Use the selector in the Stack section to see and show the threads that are currently running. Click on a specific item in the thread viewer to see the source code.